DeepSEQreen Documentation
Required Formats of the Input Files
DeepSEQreen is free and open to all users with no login requirement and can be readily accessed by a variety of popular web browsers and operating systems.
The DeepSEQreen server is to predict the binding probability or binding affinity between pairs of proteins and compounds by using amino acid sequence-based deep learning models. Therefore, users need to provide input for both proteins and compounds to be predicted. The DeepSEQreen server generally accept the following formats for proteins:
- Copy and paste your protein sequence
Any amino acid sequence (e.g., MATTG…) shorter than 1500 can be used in DeepSEQreen. Currently, the sequence length is limited to ensure the efficiency of large models while covering the majority of known protein targets. While sequence with length above 1500 is used as input, the middle 1500 amino acid squence will be used to perform prediction.
- Upload your protein sequence file in FASTA format
A sequence in FASTA format begins with a single-line description, followed by lines of sequence data. The definition line is distinguished from the sequence data by a greater-than (>) symbol at the beginning. The word following the ‘>’ symbol is the identifier of the sequence, and the rest of the line is the description (optional).
- Copy and paste the UniProt ID of your protein and click query
UniProt is one of the largest protein databases. Users can obtain the UniProt ID and Sequence by searching the protein name of interest and select the preferred one. The sequence should be available in the result page, however, as long as the complete sequence in UniProt is the protein sequence of interest, users can just paste the UniProt ID to DeepSEQreen server and click query, the embedded UniProt API will help users to get the sequence.
The DeepSEQreen server generally accept the following formats for compounds:
- Copy and paste your compound SMILES
The simplified molecular-input line-entry system (SMILES) is a specification in the form of a line notation for describing the structure of chemical species using short ASCII strings. For example:
| Drug name | 2D structure | SMILES |
| Aspirin | 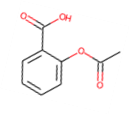 | CC(=O)Oc1ccccc1C(=O)O |
- Upload your compounds in SDF format
Drug Hit Screening
To get the potential drug hits of a given protein target, both protein sequence and compound data are needed for model prediction. For protein sequence, DeepSEQreen server can accept
- Copy and paste your protein sequence
- Copy and paste the UniProt ID of your protein and click query
- Upload your protein sequence file in FASTA format
Only ONE type of input is needed for the input protein.
If more than one protein are provided in the FASTA file, only the FIRST one will be used.
The compound data can be either the embedded library (e.g., DrugBank) or a SDF file containing all the compounds (maximum 10,000 per task). The standard format accepted by DeepSEQreen for this task can be downloaded HERE.
Target Protein Identification
To get the potential protein targets of a given compound, both protein sequences and the given compound are needed for model prediction. For the compound of interest, DeepSEQreen server can accept
- Copy and paste your compound SMILES
- Upload your compounds in SDF format
Only ONE type of input is needed for the input protein.
If more than one compound is provided in the SDF file, only the FIRST one will be used.
The target list can be either the embedded library (e.g., DrugBank) or a FASTA file containing all the target sequences (maximum 10,000 per task). If more than 10,000 compounds is uploaded, only the FIRST 10,000 will be used. The standard format accepted by DeepSEQreen for this task can be downloaded HERE.
Interaction Pair Inference
To get the potential interacted pairs among pairs of protein and compounds, two types of inputs can be accepted
- Upload your pairs in CSV format. Two columns are required, one for protein sequences and one for compound SMILES. Prediction will only be made on the pair contained in each row. If users want to mark each protein and compound with some IDs, additional columns (ID1 for compounds and ID2 for proteins) can be added inside of the CSV file.
- Upload your protein sequence file in FASTA format and upload your compounds in SDF format
DeepSEQreen will automatically construct pairs for each protein and each compound and perform prediction on them.
For both input type, the maximum number of records is 10,000 per task (i.e., for the second input methods, the multiplicity of two files should be less or equal than 10,000).
The standard format accepted by DeepSEQreen for this task can be downloaded HERE.
Chemical Property Report
Users can upload their compound data in SDF format and let DeepSEQreen calculate the molecule properties and drug likeness measures of each compound. Please refer to section 5 for more details about the current available molecule properties and drug likeness filters.
Step-by-step Instruction on the Usage of DeepSEQreen
Steps for Using Module ‘Drug Hit Screening’
Input or Upload Protein Target Sequence
By clicking on ‘Target Input Type’, users can choose either using protein sequence or UniProt ID. For both type, users can always click on ‘Example’ to get the example input. Please refer to 1.1 for the file format.
If sequence is selected, users can either (1) copy and paste the sequence of interest on the input box; or (2) click on ‘Upload sequence’ to select a FASTA file to upload.
If UniProt ID is selected, users can copy and paste the protein ID of interest on the input box (1), and click on the ‘Query’ button (2), the protein sequence from UniProt database will soon show up in input box (3)
Auto-detect Protein Family (Optional)
This optional step offer users the flexibility to choose protein-family specific model, instead of using the model trained on all protein families (all-family model). Benchmark results show that the latter is not always better than the former. Please refer to 4.3 for benchmark results. If this step is skipped, all-family model will automatically used.
By clicking on ‘Auto-detect’ button, the DeepSEQreen server will run BLAST alignment algorithm based on a pre-annotated protein set from ChEMBL v33 on backend and show the most likely protein family above the button. DeepSEQreen will then recommend CPI model (please refer to 2.1.3) based on the benchmark results on that protein family.
Select task type and get the recommendation model
DeepSEQreen offers two types of tasks: binding probability prediction and binding affinity prediction. Users can select the task they want by clicking on and choose at ‘Task’. Then, users can either select the model they preferred or clicking on ‘Recommend a model’ to obtain a recommended one. The recommendation was selected under the conditions including task type, protein family, and whether the protein sequence covered in the training, and based on the evaluation metric AUROC (Please refer to 4.2 for evaluation metric introduction and 4.3 for benchmark results).
Select or Upload Compound Library for Screening
Users can click on the ‘compound library’ to choose the embedded compound library or upload their own library for screening. The maximum number of uploaded compounds per task is 10,000. If more than 10,000 compounds are uploaded, only the first 10,000 will be used. Please refer to 1.1 for the file format.
Submit the Prediction Task and Retrieve Results
After completing the above steps, users can now submit the prediction and wait for the results. After submission, a Job ID will be provided (1). User can leave their email address (2) if they want to a reminder email for the Job ID, but this is not necessary. With Job ID, users can click on the ‘Retrieve’ button to check the progress of their task or the results if the task has already been completed.
Steps for Using Module ‘Target Protein Identification’
Input or Upload Compound SMILES
By clicking on ‘Upload a file’ to upload a SDF file or pasting the SMILES obtained from PubChem, users can simply feed the compound of interest to DeepSEQreen for target identification. An example button is also provided.
Select or Upload Target List for Screening
Users can click on the ‘Target library’ to choose the embedded target library or upload their own library for screening. The maximum number of uploaded targets per task is 10,000. If more than 10,000 targets are uploaded, only the first 10,000 will be used. Please refer to 1.2 for the file format.
Select task type and get the recommendation model
DeepSEQreen offers two types of tasks: binding probability prediction and binding affinity prediction. Users can select the task they want by clicking on and choose at ‘Task’. Then, users can either select the model they preferred or clicking on ‘Recommend a model’ to obtain a recommended one. The recommendation was selected under the conditions including task type and whether the compound SMILES covered in the training, and based on the evaluation metric AUROC (Please refer to 4.2 for evaluation metric introduction and 4.3 for benchmark results).
Submit the Prediction Task and Retrieve Results
After completing the above steps, users can now submit the prediction and wait for the results. After submission, a Job ID will be provided (1). User can leave their email address (2) if they want to a reminder email for the Job ID, but this is not necessary. With Job ID, users can click on the ‘Retrieve’ button to check the progress of their task or the results if the task has already been completed.
Steps for Using Module ‘Interaction Pair Inference’
Upload Interaction Pairs
By clicking on ‘Click to Upload’ or simply drop file to the input box, users can either upload a CSV file containing pairs of compound and protein waiting for prediction or upload one SDF file for compounds and one FASTA file. For the later case, interactions will be automatically constructed for each compound and each protein. Please refer to 1.3 for the file format.
Select task type and get the recommendation model
DeepSEQreen offers two types of tasks: binding probabililty prediction and binding affinity prediction. Users can select the task they want by clicking on and choose at ‘Task’. Then, users can either select the model they preferred or clicking on ‘Recommend a model’ to obtain a recommended one. The recommendation was selected based on the evaluation metric AUROC of random split evaluation. (Please refer to 4.2 for evaluation metric introduction and 4.3 for benchmark results).
Submit the Prediction Task and Retrieve Results
After completing the above steps, users can now submit the prediction and wait for the results. After submission, a Job ID will be provided (1). User can leave their email address (2) if they want to a reminder email for the Job ID, but this is not necessary. With Job ID, users can click on the ‘Retrieve’ button to check the progress of their task or the results if the task has already been completed.
Steps for Using Module ‘Chemical Property Report’
Retrieve Results From Prediction or Upload a List of Compounds
After the completion of the prediction tasks in 2.1, 2.2, or 2.3, the DeepSEQreen page will seamlessly transition to the Chemical Property Report page. Here, the compounds utilized for screening will be readily available, awaiting the generation of the report, which users can then download. Users have the option to directly upload a list of compounds to the Chemical Property Report module, allowing them to obtain the desired properties and drug-likeness alerts without the need for prediction.
Select the Scores and Filters and Generate the Report
DeepSEQreen offers two types of calculation: molecule properties and drug-likeness filters. Users can tick the scores and filters they want. The checked terms will be displayed in the online report by clicking the ‘Generate Report’ button. For a comprehensive list of molecule properties and drug-likeness filters covered by DeepSEQreen, please refer to section 5. The report can be downloaded as HTML or CSV file.
Elements in the Final Report
When multiple compounds were involved in DeepSEQreen tasks, the report not only provide the predicted binding probability or affinity score, but also visualize the compounds and their scaffold. Statistical information regarding the scaffold in the top screened results will also be provided. If users selected any scores or filters in step 2.4.2, these scores and filters will also be included in the report.
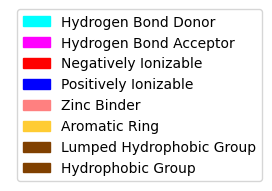
Pharmacophore Color Annotations
Interpretation of prediction confidence
The report offers different levels of annotations which aid in bolstering confidence levels and domain of applicability regarding the prediction results. Additionally, if the compound-protein pair to be predicted is present in the training set with known outcomes, the actual results from the corresponding database will be provided directly in the ‘Source’ column of the report.
Drug hit screening
- Maximum sequence identity between the input target and targets in the training set: this serves as an indicator of the prediction applicability/reliability – higher similarities indicate more reliable predictions (preferably > 0.85).
- Maximum Tanimoto similarity between the hit compound and known interacting compounds of the input target: this serves as an indicator of both the confidence level and novelty of the predicted hit compounds – higher similarities suggest greater confidence, while lower Tanimoto similarities may indicate the novelty of the identified hit compounds compared to known drugs or true interacting compounds of the input target.
- Maximum sequence identity between the input sequence and known targets of identified hit compounds: this serves as an additional indicator of the confidence level of the predicted hit compounds – higher identities usually lead to greater confidence in the predictions.
Target protein identification
- Maximum Tanimoto similarity between the input compound and compounds in the training set: this serves as an indicator of prediction applicability and reliability – higher similarities indicates more reliable predictions (ideally > 0.85).
- Maximum sequence identity between the identified target proteins and known targets of the input compound: this serves as an indicator of prediction confidence for the potential targets – higher similarities typically imply higher confidence levels.
- Maximum Tanimoto similarity between the input compound and known drugs/true interacting compounds of identified potential targets: this serves as an additional indicator of the confidence level in the predicted potential targets – higher similarities usually correspond to greater prediction confidence.
Sequence-based compound-protein interaction deep learning models
DeepDTA
Convolutional neural network (CNN) for both protein amino acid sequence and compound SMILES (after embedding layers) and the representations were concatenated and sent to the fully connected layers for prediction.
DeepConv-DTI
CNN for protein sequences (after embedding layer) with global max pooling and FC layers for compound Morgan fingerprints (radius 2 and vector 2048). Two features were concatenated and FC layers were used for prediction.
GraphDTA
CNN for protein sequences (after embedding layer) and graph neural network (one of GCN, GAT, GIN and GAT-GCN) for compounds. Two features were concatenated and FC layers were used for prediction.
TransformerCPI
Protein sequences are first segmented to 3-mer (overlapping 2), embedded using word2vec, and processed by simplified transformer encoder (gated CNN + linear units). Compounds are represented using graph neural network (GNN) with 34 atom features calculated using rdkit. Two features were decoded through transformer decoder with multi-head attention layers, ended with FC layers for prediction.
VQA-seq
MolTrans
A data-driven sequential pattern mining algorithm called FCS algorithm is applied to find recurring sub-sequences across drug and protein databases. The tokenized sets were built from UniProt and ChEMBL.
The substructures of proteins and compounds are embedded through embedding layer and processed by a transformer framework for feature extraction. The interaction features are the dot-product of two features and CNN is used for further capturing neighborhood interaction and make prediction.
HyperAttentionDTI
Protein sequences and compound SMILES strings were sent to embedding and CNNs to get the latent representation. A specific attention block, HyperAttention, was used for interaction, which considered not only spatial but also channel (i.e., the dimension for attention matrix is drug length * protein length * channel dim)
MGraphDTA
Protein sequences were first fed into embedding layer and then processed by a multiscale CNN, which concatenate representations from three convolutional blocks (each with different depth: 1, 2, 3)
A multiscale graph neural network was developed, where dense connections link each layer to every other layer in a feed-forward fashion. Dense layer concatenates the hidden representation Xn with {X1, …, Xn-1}. A transition layer was applied to reduce the channel numbers to half of the input to save computational cost.
Two features were concatenated and FC layers were used for prediction.
DrugBAN
CNN for protein sequences (after embedding layer). For compound, 74-dimensional integer vector describes 8 pieces of information: the atom type, the atom degree, the number of implicit Hs, the formal charge, the number of radical electrons, the atom hybridization, the number of total Hs and whether the atom is aromatic. The feature vectors are processed by a linear transformation and 3-layer GCN. The interaction features are learned through bilinear attention network and sum pooling.
TransformerCPI2.0
TAPE-BERT pretraining protein language model is used to embed each protein sequence into a 768-dimension vector. The vector is further processed using a multi-head transformer. For compound, one class token was initialized using zero-vector and processed using one-layer GCN. Two features are integrated using transformer decoder, where class token is used for prediction.
Benchmark Data and Results for Model Validation and Recommendation
Benchmark Data
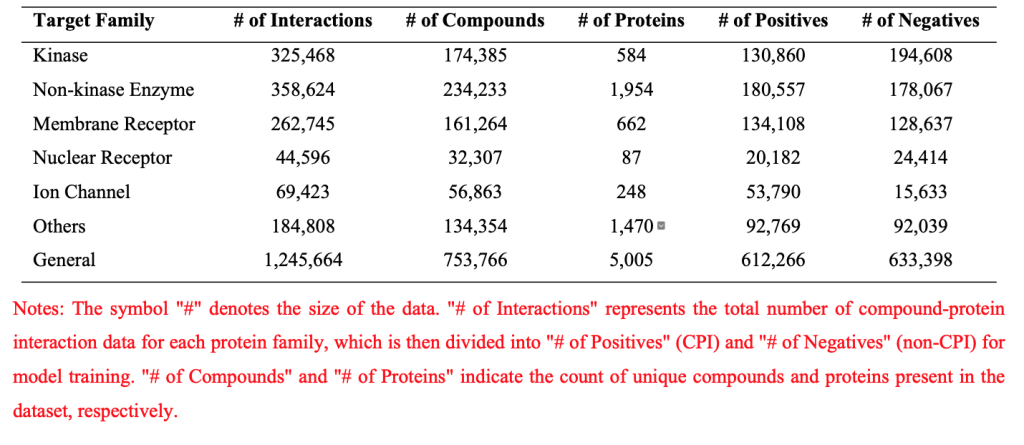
Details of Data used in Interaction Prediction Models
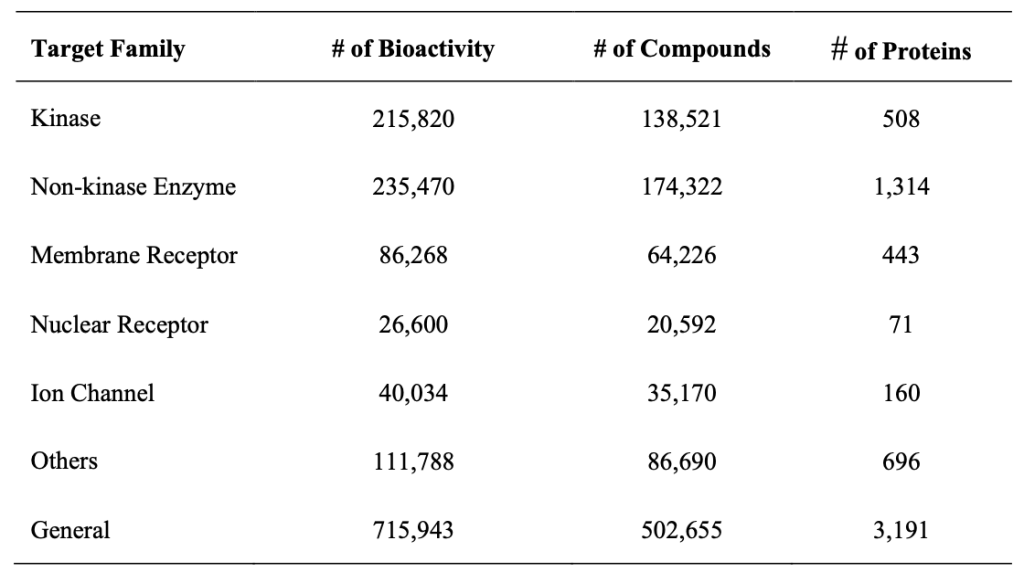
Details of Data used in Affinity (IC50) Prediction Models
Evaluation Metrics
Area Under the Receiver Operating Characteristic Curve (AUROC)
$\text{AUROC} = \int_{0}^{1} \text{TPR}(\text{FPR}^{-1}(t)) dt$
where:
(\text{TPR}) is the True Positive Rate (Sensitivity),
(\text{FPR}) is the False Positive Rate (1 – Specificity),
(\text{FPR}^{-1}) is the inverse function of the FPR,
(t) is the threshold value.
The AUROC value ranges from 0 to 1, where a higher value indicates better performance of the model. An AUROC of 0.5 suggests that the model performs no better than random guessing, while an AUROC of 1 indicates a perfect classifier.
Concordance Index (CI)
$c\text{-index} = \frac{\sum_{i,j} 1_{(T_j < T_i)} \cdot 1_{(\eta_j > \eta_i)} \cdot \delta_j}{\sum_{i,j} 1_{(T_j < T_i)} \cdot \delta_j}$
The concordance index or c-index is defined as the proportion of concordant pairs divided by the total number of possible evaluation pairs.
Similarly to the AUC, c-index of 1 corresponds to a perfect prediction, and c-index of 0 represents a random prediction.
Benchmark Results

Figure.1 AUROC of integrated CPI models across selected target families and test scenarios.
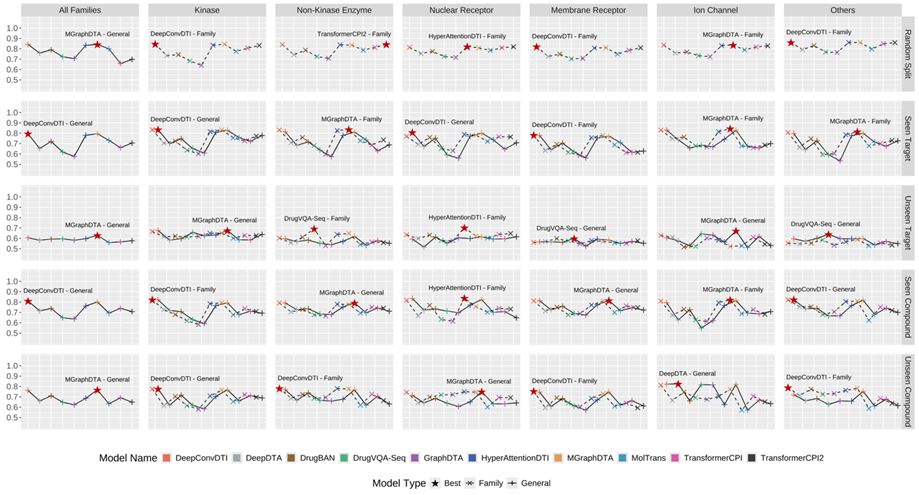
Figure.2 CI of integrated CPA models across selected target families and test scenarios.
Molecule Properties and Drug-Likeness Measures
Molecule Properties
SAscore
Synthetic accessibility score is designed to estimate ease of synthesis of drug-like molecules, based on a combination of fragment contributions and a complexity penalty. The score is between 1 (easy to make) and 10 (very difficult to make). The synthetic accessibility score (SAscore) is calculated as a combination of two components: molecular complexity and fragment contributions.
RAscore
Retrosynthetic accessibility score (RAscore) is a score learned from the predictions of a computer aided synthesis planning tool.
SCscore
SCScore, synthetic complexity score, is designed to assign a low score to molecules that are easy to synthesize and a high score to molecules that are hard to synthesize.
LogP
The logarithm of the n-octanol/water distribution coefficient, logP, possess a leading position with considerable impact on both membrane permeability and hydrophobic binding to macromolecules, including the target receptor as well as other proteins like plasma proteins, transporters, or metabolizing enzymes.
Molecule Weight (MW)
Hydrogen Bond Doner (HBD)
Hydrogen Bond Acceptor (HBA)
TopoPSA
Topological polar surface area, a descriptor defined as the sum of surfaces of polar atoms in a molecule.
Drug-Likeness Measures
Lipinski’s Rule of Five
Lipinski’s rule of five, also known as Pfizer’s rule of five or simply the rule of five (RO5), is a rule of thumb to evaluate druglikeness or determine if a chemical compound with a certain pharmacological or biological activity has chemical properties and physical properties that would likely make it an orally active drug in humans.
Lipinski’s rule states that, in general, an orally active drug has no more than one violation of the following criteria:
- No more than 5 hydrogen bond donors (the total number of nitrogen–hydrogen and oxygen-hydrogen bonds)
- No more than 10 hydrogen bond acceptors (all nitrogen or oxygen atoms)
- A molecular mass less than 500 daltons
- A calculated octanol-water partition coefficient (ClogP) that does not exceed 5
Glaxo Hard Filters
The “hard filters” rule set developed at Glaxo Wellcome, consisting of 55 patterns of undesired functional groups.
Dundee Rule Set
A rule set developed at the University of Dundee, consisting of 105 patterns of unwanted functional groups and substructures that likely cause interference with HTS assays.
BMS HTS Deck Filters
The “HTS deck filters” rule set developed at Bristol-Meyers Squibb, consisting of 180 patterns of unwanted functional groups derived from intuition and experience.
PAINS Set
The PAINS set of substructures linked to assay interference, consisting of 480 patterns.
MLSMR Excluded Functionality Filters
The “excluded functionality filters” rule set of the NIH Molecular Libraries Small Molecule Repository, consisting of 116 patterns for removing unwanted functional groups.
